# Python 机器学习常用库的使用
# 一、Numpy 库
# 1、array 函数创建数组对象
import numpy as np | |
arr1 = np.array([1,2,3],dtype='float') #创建一个一维数组,其数据类型为 float | |
print(arr1) -> [1 2 3] | |
arr2 = np.array([[1,2,3],[4,5,6]]) #创建一个二维数组 | |
print(arr2) -> [[1 2 3][4 5 6]] |
# 2、通过 arange、linspace 函数创建等差数组对象
函数语法格式: 左闭右开区间
函数语法格式: 闭区间
import numpy as np | |
a_arange = np.arrage(1,20,5) | |
print(a_arange) -> [1 6 11 16] | |
a_linespace = np.linspace(-1,2,5) | |
print(a_linespace) -> [-1 0.25 0.5 1.25 2] |
# 3、通过 logspace 函数创建等比数组
语法格式:
import numpy as np | |
a_logspace = np.logspace(0,0,10,base=2) | |
print(a_logspace) ->[1,2,4,8,16,32,64,128,256,512] |
# 4、函数 zeros,ones,diag,eye,full 的使用
import numpy as np | |
a_zeros1 = np.zeros(3,dtype=int) #创建元素值都为 0 的一维数组,数据类型为 int | |
print(a_zeros1) ->[0 0 0] | |
a_zeros2 = np.zeros([3,4]) #创建元素值都是 0 的二维数组 | |
print(a_zeros2) ->[[0 0 0 0][0 0 0 0][0 0 0 0]] | |
#ones 函数的用法和 zeros 很像,区别在于生成的数组值都为 1 | |
c_diag = np.diag([1,2,3,4]) #创建给定对角线的二维数组 | |
print(c_diag) ->[[1 0 0 0][0 2 0 0][0 0 3 0][0 0 0 4]] | |
d_eye = np.eye(3) #创建单位数组 | |
print(d_eye) ->[[1 0 0][0 1 0][0 0 1]] | |
e_full = np.full([4 4],3) #创建值相同的二维数组 | |
print(e_full) ->[[3 3 3 3][3 3 3 3][3 3 3 3][3 3 3 3]] |
# 5、Numpy 多维数组产生随机数
import numpy as np | |
np.random.seed(100) #同一随机数种子生成的随机数相同 | |
a = np.random.randint(0,20,5) #生成随机一维数组,5 个 0 到 20 的整数 | |
print(a) -> [8 3 7 15 16] | |
b = np.random.randint(0,20,(3,4)) #3 行 4 列的二维数组,随机数大小都位于 0 到 20 | |
print(b) ->[[10 2 2 2][14 2 17 16][15 4 11 16]] | |
c = np.random.rand(5) #5 个介于 [0,1) 的随机数一维数组 | |
print(c) ->[0.56229626,0.003124,0.3413341,0.6352321,0.4235985] | |
d = np.random.randn(5) #产生 5 个标准正态随机分布组成的一维数组 | |
print(d) ->[-0.23198063 -0.51772213 1.43018797 0.94971126 0.65692046] |
其次,还有一个 函数
import numpy as np | |
a = np.arrange(10) | |
np.random.shuffle(a) | |
print(a) -> [8 1 4 6 7 2 5 3 0 9] | |
b = np.arrange(1,13).reshape(3,4) | |
np.random.shuffle(b) | |
print(b) -> [[5 6 7 8][9 10 11 12][1 2 3 4]] |
# 6、Numpy 多维数组的属性
import numpy as np | |
a = np.arange(1,13) | |
# a.ndim () 返回数组维度 | |
print(format(a.ndim)) ->1 | |
# a.shape () 返回数组的形状 | |
print(format(a.shape)) ->(12,) | |
# a.size () 返回数组的元素个数 | |
print(format(a.size)) ->12 | |
# reshape (shape) 不改变数组元素,返回一个 shape 形状的数组 | |
b = a.reshape(3,4) | |
print(b) -> [[1 2 3 4][5 6 7 8][9 10 11 12]] | |
c = b.flatten() | |
print(c) -> [1 2 3 4 5 6 7 8 9 10 11 12] |
# 7、数组合并
import numpy as np | |
A = np.zeros([2,3]) | |
B = np.ones([2,4]) | |
# hstack 为水平合并 | |
print(np.hstack(A,B)) | |
# -> | |
# [[0 0 0 1 1 1 1] | |
# [0 0 0 1 1 1 1]] | |
# concatenate 可选择 axis=0 时为垂直,axis=1 时为水平 | |
print(np.concatenate((A,B),axis=1)) | |
# -> | |
# [[0 0 0 1 1 1 1] | |
# [0 0 0 1 1 1 1]] | |
A = np.zeros([2,4]) | |
B = np.ones([2,4]) | |
print(np.vstack(A,B)) | |
# -> | |
# [[0 0 0 0] | |
# [0 0 0 0] | |
# [1 1 1 1] | |
# [1 1 1 1]] |
# 8、数组分割
import numpy as np | |
a = np.arange(12).reshape(3,4) | |
print(np.hsplit(a,2)) #水平分割 | |
# -> [array([[0,1],[4,5],[8,9]]),array([[2,3],[6,7],[10,11]])] | |
print(np.vsplit(a,3)) #垂直分割 | |
# -> [array([[0,1,2,3]]),array([[4,5,6,7]]),array([[8,9,10,11]])] | |
print(np.split(a,2,axis=1)) #axis=1 为水平分割,axis=0 为垂直分割 |
# 9、一维数组索引和切片
这个和列表 的用法是差不多的
# arr [0,1] 索引访问指定某个元素,第一行第二列 | |
# arr [[1,3],:] 索引访问指定某行元素,第 2,4 行元素 | |
# arr [:,0:3] 索引访问指定某些列的元素,第 1,2,3 列的元素 | |
# arr [2:,2:] 索引访问指定某些元素,从第三行第三列开始的元素 | |
# arr [-2:,-3:] 数组最后两行最后三列的元素 |
# 10、数组的访问
# np.append (arr,x) 在数组 arr 后面增加一个元素为 x | |
# np.insert (arr,pos,x) 在数组 arr 索引为 pos 的位置插入元素 x | |
# np.delete (arr,pos) 删除数组 arr 索引为 pos 的元素 |
# 11、数组的去重与重复
# np.unique 找出数组的唯一值并返回已经排序的结果 | |
# np.tile (arr,3) 返回 arr 数组重复 3 次的数组 | |
# np.repeat (arr,2,axis=0) 返回 arr 数组按行重复 2 次的数组,即 [[1][2]] 变为 [[1][1][2][2]] | |
# axis=0 是行重复,1 是列重复 |
# 12、统计函数
# np.sum (a,axis) 计算数组中沿指定轴的和 | |
# np.min (a,axis) 计算数组中沿指定轴的最小值 | |
# np.argmin (a,axis) 计算数组中沿指定轴的最小值的索引 | |
# np.max (a,axis) 计算数组中沿指定轴的最大值 | |
# np.argmax (a,axis) 计算数组中沿指定轴的最大值的索引 | |
# np.median (a,axis) 计算数组中沿指定轴的中位数 | |
# np.mean (a,axis) 计算数组中沿指定轴的平均数 | |
# np.std (a,axis) 计算数组标准差 | |
# np.var (a,axis) 计算数组方差 | |
# np.cov (a) 计算数组协方差矩阵 |
# 二、Matplotlib 库
# 1、Figure
对象可以理解成是一个画板
import matplotlib as plt | |
fig = plt.figure() |
# 2、Axes
就是轴,一幅图总有 轴, 轴, 轴之类的轴来确定
fig = plt.figure() | |
ax = fig.add_subplot(1,1,1) | |
# 在 figure 的第一行第一列的第一个位置生成一个 Axes 对象作画 | |
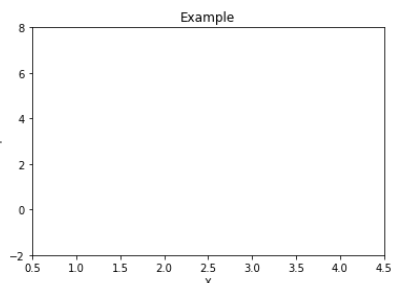
ax.set(xlim=[0.5,4.5],ylim=[-2,8],title='Example',ylabel='Y',xlabel='X') | |
plt.show() |
效果如下图:
# 3、add_subplot 函数
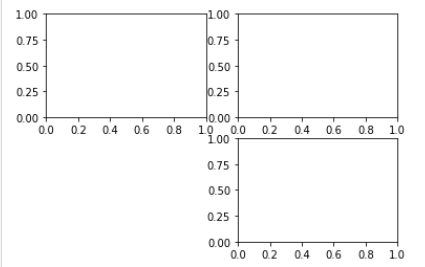
fig = plt.figure() | |
ax1 = fig.add_subplot(2,2,1) | |
ax2 = fig.add_subplot(2,2,2) | |
ax3 = fig.add_subplot(2,2,4) |
效果如如下:
# 4、画函数
函数画出一系列点并用线将它们连接起来
import numpy as np | |
import matplotlib.pyplot as plt | |
x = np.linspace(0,np.pi) | |
y_sin = np.sin(x) | |
y_cos = np.cos(x) | |
fig = plt.figure() | |
ax1 = fig.add_subplot(2,2,1) | |
ax2 = fig.add_subplot(2,2,2) | |
ax3 = fig.add_subplot(2,2,4) | |
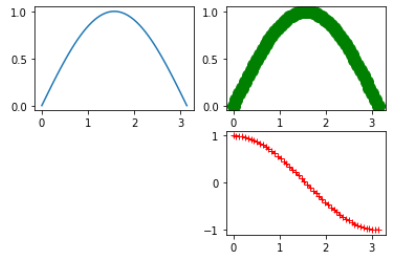
ax1.plot(x,y_sin) | |
ax2.plot(x,y_sin,'go--',linewidth=2,markersize=12) | |
ax3.plot(x,y_cos,color='red',marker='+',linestyle='dashed') | |
plt.show() |
效果如如下
# 5、画散点图
import numpy as np | |
import matplotlib.pyplot as plt | |
x = np.arange(10) | |
y = np.random.randn(10) | |
plt.scatter(x,y,color='red',marker='+') | |
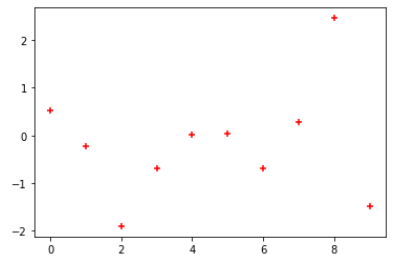
plt.show() |
效果图如下:
# 6、条形图
条形图分为水平的和垂直的
import numpy as np | |
import matplotlib.pyplot as plt | |
np.random.seed(1) | |
x = np.arange(5) | |
y= np.random.randn(5) | |
fig,axes = plt.subplots(ncols=2,figsize=plt.figaspect(1./2)) | |
vert_bars = axes[0].bar(x,y,color='lightblue',align='center') | |
horiz_bars = axes[1].barh(x,y,color='lightblue',align='center') | |
axes[0].axhline(0,color='gray',linewidth=2) | |
axes[1].axvline(0,color='gray',linewidth=2) | |
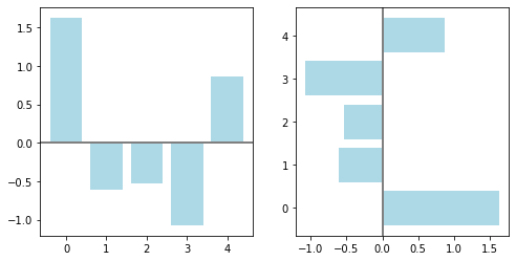
plt.show() |
效果如如下:
# 7、直方图
直方图用于统计出现的次数或者频率,有多种参数可以调整
import numpy as np | |
import matplotlib.pyplot as plt | |
np.random.seed(114514) | |
n_bins = 10 | |
x = np.random.randn(1000,3) | |
fig,axes = plt.subplots(nrows=2,ncols=2) | |
ax0,ax1,ax2,ax3 = axes.flatten() | |
colors = ['red','tan','lime'] | |
ax0.hist(x,n_bins,density=True,histtype='bar',color=colors,label=colors) | |
ax0.legend(prop={'size':10}) | |
ax0.set_title('bar with legend') | |
ax1.hist(x, n_bins, density=True, histtype='barstacked') | |
ax1.set_title('stacked bar') | |
ax2.hist(x, histtype='barstacked', rwidth=0.9) | |
ax3.hist(x[:, 0], rwidth=0.9) | |
ax3.set_title('different sample sizes') | |
fig.tight_layout() | |
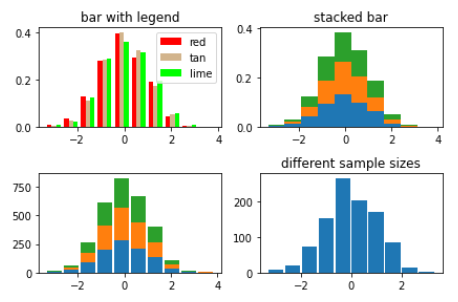
plt.show() |
效果图如下:
# 8、饼状图
import matplotlib.pyplot as plt | |
labels = ('Frogs','Hogs','Dogs','Logs') | |
sizes = [15,30,45,10] | |
explode =(0,0.1,0,0) | |
fig1,(ax1,ax2) = plt.subplots(2) | |
ax1.pie(sizes,labels=labels,autopct='%1.1f%%',shadow=True) | |
ax1.axis('equal') | |
ax2.pie(sizes,autopct='%1.2%%',shadow=True,startangle=90,explode=explode,pctdistance=1.12) | |
ax2.axis('equal') | |
ax2.legend(labels=labels,loc='upper right') | |
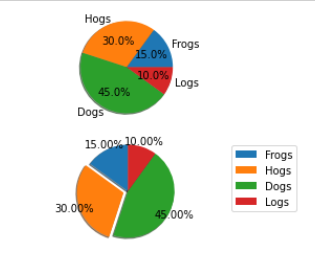
plt.show() |
效果图如下:
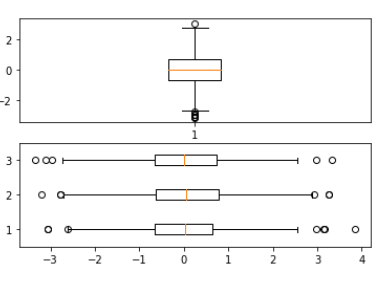
# 9、箱型图
虽然用的不多吧,但毕竟是一个用于总结的文章,加上吧
import matplotlib.pyplot as plt | |
import numpy as np | |
np.random.seed(114514) | |
fig, (ax1, ax2) = plt.subplots(2) | |
data = np.random.randn(1000,1) | |
data2 = np.random.randn(1000,3) | |
ax1.boxplot(data) | |
ax2.boxplot(data2, vert=False) #控制方向 |
效果如下:
# 10、泡泡图
和箱型图一样,加上吧
import numpy as np | |
import matplotlib.pyplot as plt | |
np.random.seed(114514) | |
n = 50 | |
x = np.random.rand(n) | |
y = np.random.rand(n) | |
colors = np.random.rand(n) | |
area = (30 * np.random.rand(n))**2 | |
plt.scatter(x, y, s=area, c=colors, alpha=0.5) | |
plt.show() |
# 效果图如下:

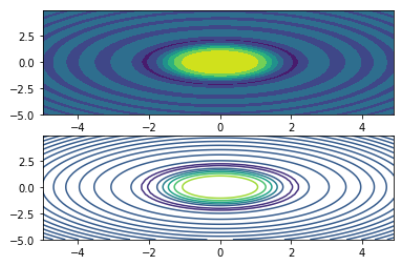
# 11、等高线
同上,一般不会用
import numpy as np | |
import matplotlib.pyplot as plt | |
fig,(ax1,ax2) = plt.subplots(2) | |
x = np.arange(-5,5,0.1) | |
y = np.arange(-5,5,0.1) | |
xx,yy=np.meshgrid(x,y,sparse=True) | |
z = np.sin(xx**2+yy**2)/(xx**2+yy**2) | |
ax1.contourf(x,y,z) #contourf 会填充轮廓间的颜色 | |
ax2.contour(x,y,z) |
效果图如下:
# 12、区间调整
import numpy as np | |
import matplotlib.pyplot as plt | |
ax.set_xlim([xmin,xmax]) #设置 x 轴区间 | |
ax.set_ylim([ymin,ymax]) #设置 y 轴区间 | |
ax.axis([xmin,xmax,ymin,ymax]) #设置 x,y 轴区间 | |
ax.set_ylim(bottom=-10) #Y 轴下限 | |
ax.set_xlim(right=25) #X 轴上限 |
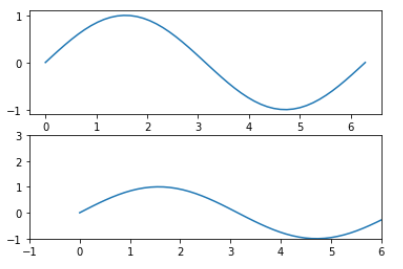
实例演示:
import numpy as np | |
import matplotlib.pyplot as plt | |
x = np.linspace(0,2*np.pi) | |
y = np.sin(x) | |
fig, (ax1,ax2) = plt.subplots(2) | |
ax1.plot(x,y) | |
ax2.plot(x,y) | |
ax2.set_xlim([-1,6]) | |
ax2.set_ylim([-1,3]) | |
plt.show() |
效果图如下:
# 13、设置标注名
import matplotlib.pyplot as plt | |
fig ,ax = plt.subplots() | |
ax.plot([1,2,3,4],[10,20,25,30],label='BeiJing') | |
ax.plot([1,2,3,4],[30,23,13,4],label='NanJing') | |
ax.set(ylabel='Temperature(deg C)',xlabel='Time') | |
ax.legend() | |
plt.show() |
效果图如下:
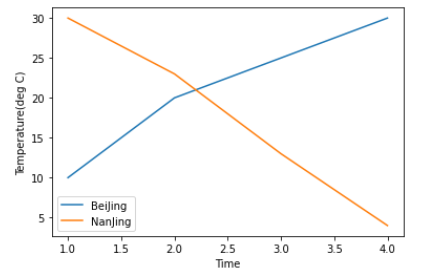
其中 里面可以传参数,用来调整图例的位置,参数表如下:
| Location String | Location Code |
| :-------------: | :-----------: |
| 'best' | 0 |
| 'upper right' | 1 |
| 'upper left' | 2 |
| 'lower left' | 3 |
| 'lower right' | 4 |
| 'right' | 5 |
| 'center left' | 6 |
| 'center right' | 7 |
| 'lower center' | 8 |
| 'upper center' | 9 |
| 'center' | 10 |
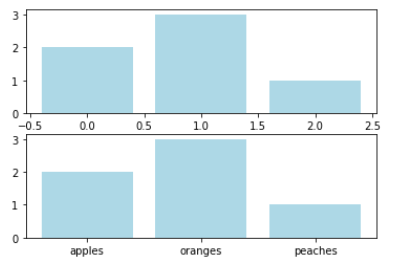
# 14、区间分段
import numpy as np | |
import matplotlib.pyplot as plt | |
data = [('apples',2),('oranges',3),('peaches',1)] | |
fruit,value = zip(*data) | |
fig , (ax1,ax2) = plt.subplots(2) | |
x = np.arange(len(fruit)) | |
ax1.bar(x,value,align='center',color='lightblue') | |
ax2.bar(x,value,align='center',color='lightblue') | |
ax2.set(xticks=x,xticklabels=fruit) | |
#ax.tick_params (axis='y',direction='inout',length=10) 修改 ticks 的方向和长度 | |
plt.show() |
效果图如下:
# 15、子图布局
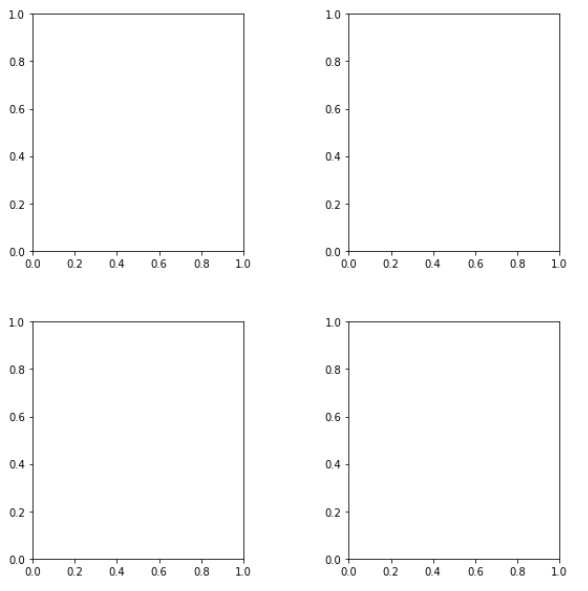
这一部分可以调整子图之间的间隔,子图与画板的外边间距以及子图的内边间距等功能
import matplotlib.pyplot as plt | |
fig,axes = plt.subplots(2,2,figsize=(9,9)) | |
fig.subplots_adjust(wspace=0.5,hspace=0.3,left=0.125,right=0.9,top=0.9,bottom=0.1) | |
#fig.tight_layout () #自动调整布局,使标题不重叠 | |
plt.show() |
效果图如下:
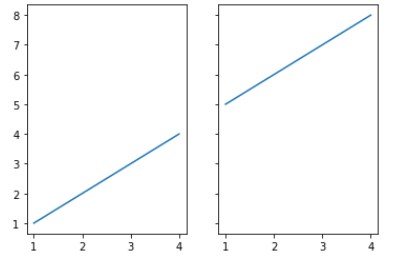
这四个子图的 X,Y 区间是一致的,可以调整它们使用一样的 X,Y
import matplotlib.pyplot as plt | |
fig,(ax1,ax2)=plt.subplots(1,2,sharex=True,sharey=True) | |
ax1.plot([1,2,3,4],[1,2,3,4]) | |
ax2.plot([1,2,3,4],[5,6,7,8]) | |
plt.show() |
效果图如下:
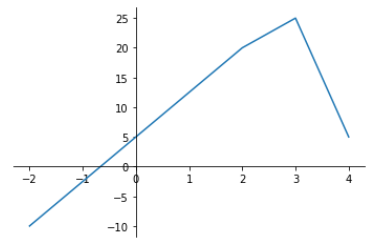
# 16、边框去除
import numpy as np | |
import matplotlib.pyplot as plt | |
fig ,ax =plt.subplots() | |
ax.plot([-2,2,3,4],[-10,20,25,5]) | |
ax.spines['top'].set_visible(False) | |
ax.xaxis.set_ticks_position('bottom') | |
ax.spines['right'].set_visible(False) | |
ax.yaxis.set_ticks_position('left') | |
# outward | |
# 移动左、下边界离 Axes 10 个距离 | |
# ax.spines['bottom'].set_position(('outward',10)) | |
# ax.spines['left'].set_position(('outward',10)) | |
# data | |
# 移动左、下边界到 (0,0) 处相交 | |
ax.spines['bottom'].set_position(('data',0)) | |
ax.spines['left'].set_position(('data',0)) | |
# axes | |
# 移动边界,按 Axes 的百分比位置 | |
# ax.spines['bottom'].set_position(('axes',0.75)) | |
# ax.spines['left'].set_position(('axes',0.3)) | |
plt.show() |
效果图如下:
# 三、Re 库
库主要是用于字符串匹配,在处理数据方面有着较为重要的作用,其主要功能函数表如下:
| 函数 | 说明 |
| :-------------: | :-----------: |
| re.search () | 在一个字符串中搜索出匹配正则表达式的第一个位置,返回 match 对象 |
| re.match () | 从一个字符串的开始位置起匹配正则表达式,返回 match 对象 |
| re.findall () | 搜索字符串,以列表类型返回全部能匹配的字符串 |
| re.split () | 将一个字符按照正则表达式匹配结果进行分割,返回列表类型 |
| re.finditer () | 搜索字符串,返回一个匹配结果的迭代类型,每个迭代元素式 match 对象 |
| re.sub () | 在一个字符串中替换所有匹配正则表达式的子串,返回替换后的字符串 |
# 1、search()
import re | |
s = "I have a dream that one day" | |
ret = re.seach("^I.*day$",s) # 检查字符串以 'I' 开头,以 'day' 结尾 | |
ret1 = re.search("\s",s) # 在字符串中搜索第一个空白字符 | |
ret2 = re.search("the",s) # 在字符串中检索特定内容,如果没有检索到就返回 None | |
ret3 = re.search("HAVE",s,re.I) #忽略大小写匹配 | |
print(ret) | |
print(ret.group()) | |
print(ret[0]) |


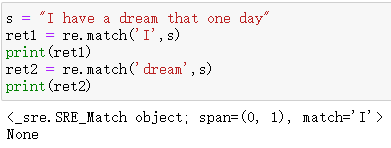
# 2、match()
import re | |
s = "I have a dream that one day" | |
ret1 = re.match('dream',s) | |
print(ret1) | |
ret2 = re.match('the',s) | |
print(ret2) | |
# 由于是第一个开始匹配,所以匹配失败返回 None | |
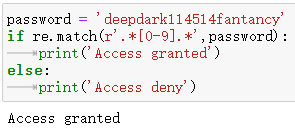
password = 'deepdark114514fantancy' | |
if re.match(r'.*[0-9].*',password): | |
print('Access granted') | |
else: | |
print('Access deny') |
# 3、split()
import re | |
s = "I have a dream that one day" | |
ret1 = re.split("\s",s) | |
print(ret1) | |
# 指定了 maxsplit,控制出现次数 | |
ret2 = re.split("\s",s,3) | |
print(ret2) | |
ret3 = re.split("ahaki",s) | |
print(ret3) | |
ss = "a b;c! d e;f,g" | |
ret4 = re.split(";",ss) # 单个切割符 | |
print(ret4) | |
ret5 = re.split("[:,!]",ss) # 多个切割符 | |
print(ret5) | |
ret6 = re.split("(?:[:,!])",ss) # 多个切割符并捕获分组,不保留分隔符 | |
print(ret6) |

# 4、sub()
import re | |
s = "我最喜欢的数字是114514" | |
ss = re.sub(r'[0-9]','*',s) | |
print(ss) | |
# 输出是 "我最喜欢的数字是 ******" |
# 四、cv2 库
必须要写的一点是这个库的安装流程
首先先检查自己的 版本,本人用的是 3.6 版本的,直接输入
pip install opencv-python |
会安装失败,报一大堆错误,而且很慢,所以考虑安装老一点的版本然后用国内镜像安装
pip install -i https://pypi.douban.com/simple/ pip install opencv-python==4.3.0.38 |
完成安装后就可以调用了
以下是 库实验图片:

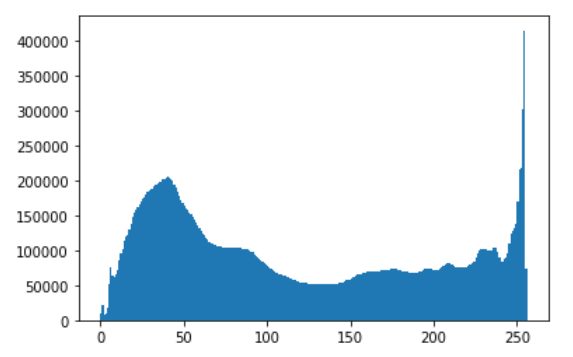
# 1、读入图像并画出直方图
import numpy as np | |
import cv2 | |
from matplotlib import pyplot as plt | |
img = cv2.imread('F:/images/Assassin\'s Creed.jpg',1) | |
plt.hist(img.reshape([-1]),256,[0,256]) | |
plt.show() |
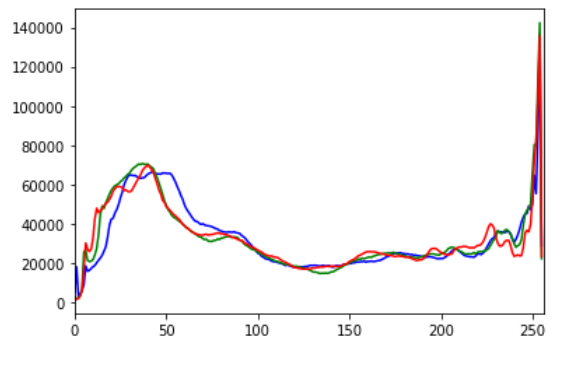
# 2、画出 rgb 三色图像直方图
import cv2 | |
from matplotlib import pyplot as plt | |
img = cv2.imread('F:/images/Assassin\'s Creed.jpg',1) | |
color = ('b','g','r') | |
for i,col in enumerate(color): | |
histr = cv2.calcHist([img],[i],None,[256],[0,256]) | |
plt.plot(histr,color=col) | |
plt.xlim([0,256]) | |
plt.show() |
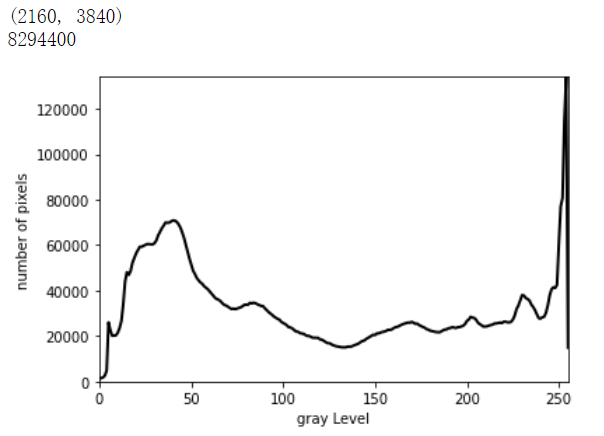
# 3、画出灰度直方图
import sys | |
import numpy as np | |
import cv2 | |
import matplotlib.pyplot as plt | |
def main(): | |
img = cv2.imread('F:/images/Assassin\'s Creed.jpg',0) | |
# 得到计算灰度直方图的值 | |
n = np.array(img) | |
xy = xygray(img) | |
# 画出灰度直方图 | |
x_range = range(256) | |
plt.plot(x_range,xy,"r",linewidth=2,c='black') | |
# 设置坐标轴的范围 | |
y_maxValue=np.max(xy) | |
plt.axis([0,255,0,y_maxValue]) | |
# 设置坐标轴标签 | |
plt.xlabel('gray Level') | |
plt.ylabel('number of pixels') | |
plt.show() | |
def xygray(img): | |
# 得到高度和宽 | |
rows ,cols = img.shape | |
print(img.shape) | |
# 储存灰度直方图 | |
xy = np.zeros([256],np.uint64) | |
for r in range(rows): | |
for c in range(cols): | |
xy[img[r][c]] += 1 | |
# 返回以为 ndarry | |
print(xy.sum()) | |
return xy | |
main() |
